
For anyone who has not worked with a Financial Advisor, this question has likely crossed their mind at least once. According to Statista,* 65% of Americans in 2020 indicated that they do not work with a Financial Advisor. Given how events unfolded last year, if there was ever a time to engage an advisor, that was it!
But, how does this financial planning process begin? What kind of discussions are had? What does a Financial Plan actually look like?
The Details of a Financial Plan
A Financial Plan tells us a wide variety of information about someone’s current situation, and addresses the ultimate objective of retirement planning. Data such as income, assets or liabilities, as well as non-financial information such as an upcoming wedding, medical diagnosis or other comparable event are all included in the final plan output. After aggregation, the plan then becomes the living, foundational document upon which we will continually return to check our actual progress toward achieving your goals against the assumptions we made at the inception of the plan.
In terms of visual presentation, the aesthetic appearance of the plan will vary depending on the software used to produce it. We utilize Financial Profiles, which will be our point of reference below.
Financial Plan Breakdown
Inside of the plan document itself, there are a number of different sections that explain the various aspects of a client’s data and their objectives.
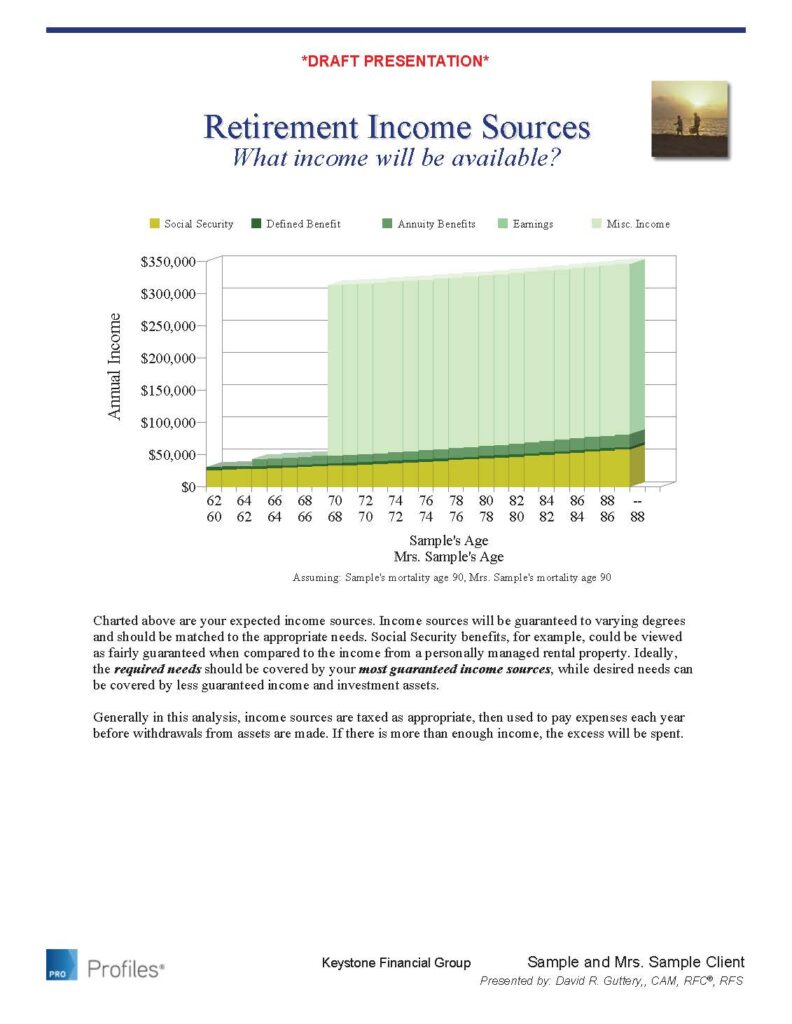
Your Cash Flow
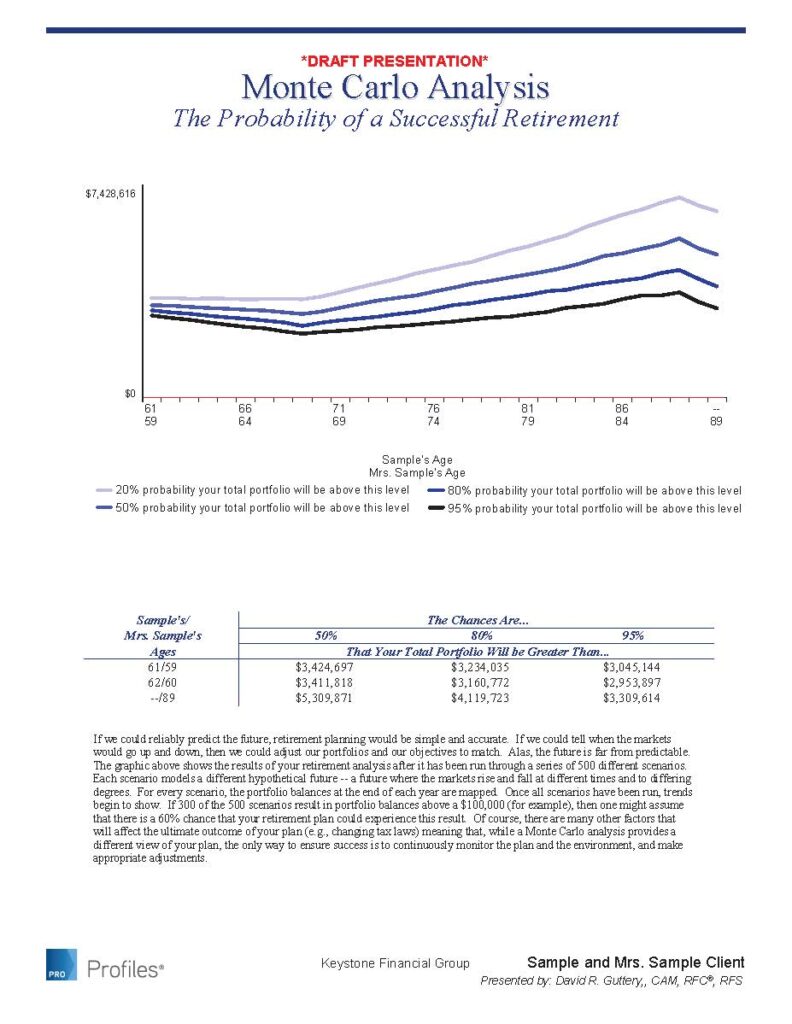
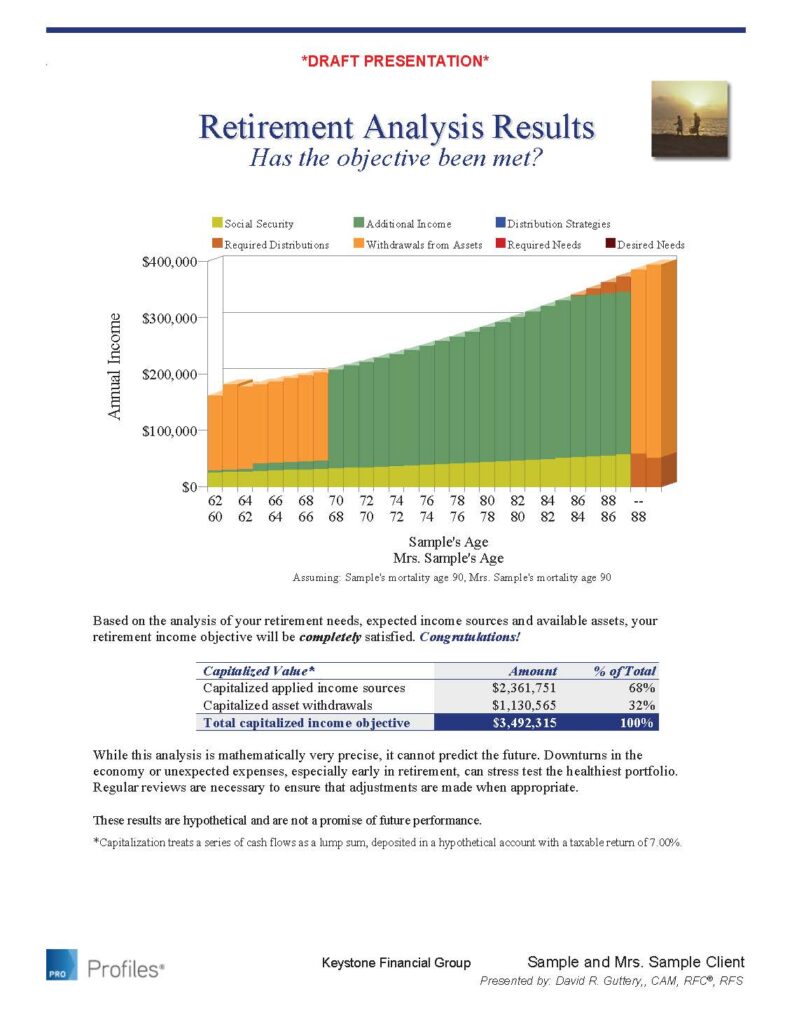
One such section pertains to cash flows over time, with a segmented bar chart that outlines each source of income – salary, passive investments, social security, pensions, and so on – which will also display any shortfall of income given your projected expenses at that point. Also included are summaries related to assets & liabilities, tax efficiency, and a Monte Carlo analysis that illustrates the plan’s overall chance of success at its conclusion. We can further break down the data and include future events, such as a change in employment or the sale of real estate, to better refine what your future might look like.
Testing Your Financial Plan
To describe it succinctly, the Monte Carlo analysis is a test. The plan details and assumptions are checked against 1,000 different market scenarios, ranging from a boom of +30% or a bust of -38%, to assess the chance of that plan’s success as you get older, as displayed over four “confidence intervals” on a line graph. When creating the plan, the Monte Carlo simulation is the first reality check on the plan details – the retirement income plan may be to distribute $10,000/month during retirement, but if that causes all four confidence intervals to plow into the red line, then we’ll need to alter the plan’s assumptions to avoid depleting cash reserves midway through retirement. Over time, we can go back to the plan and make updates on an as-needed basis, and the Monte Carlo analysis will then update to reflect any changes that we make.
Conclusion
In short, constructing a Financial Plan does take time, but it can be of tremendous value in projecting what the future may hold, as well as beginning early retirement planning. It can also demonstrate how making a seemingly small change today can significantly impact future performance.
*https://www.statista.com/statistics/1176393/financial-advisor-usa/

