If you have been watching our video and podcast series this year, then you know that we have paid particular attention to many economic metrics as we have observed the closure of the United States economy, it’s re-opening, and looking to those metrics for direction as to market exposure and investment opportunities.
In this article, we are going to discuss the paradox with the letter “V”. In April, the widely held opinion was that we would not experience a V-shaped recovery in either the economy or the market. Indeed, that seems to be exactly what is developing before our very eyes.
I have a chart drawn on the board of my conference room that depicts the economic cycle. It looks like a sine wave. There are certain exposures that you want to have during certain periods of the economic cycle, and others that you want to avoid. Part of my job is to analyze information at hand, to help clients understand where we are in the cycle and by extension, where we should have assets allocated as conditions change.
Five months ago, the question was, “where do we emerge in the economic cycle as the market reopens?” Is it really possible to shut down the economy, and then turn it back on again? Clearly, that road was not very well lit at the time. But over the months we have had a slew of economic metrics to guide us toward the most educated answer. Today, I am convicted in the thought that we have indeed re-emerged with the growth phase of this economic cycle intact.
Before we progress further, let’s take a quick look at where we are in the market.
As of 26 August, the S&P 500 index close to the value of 3,478 points. That is a 58.74% gain from the intraday low that we observed on the 23rd of March. I am a visual person, and clearly this graph depicts a letter “V” that very few, if any experts suggested that we would observe just five months ago.
Many of my clients are asking if this market resurgence is real. They want to know what might be driving this market momentum. Again, I turn to the litter “V”, keeping in mind that sometimes that letter can be inverted.
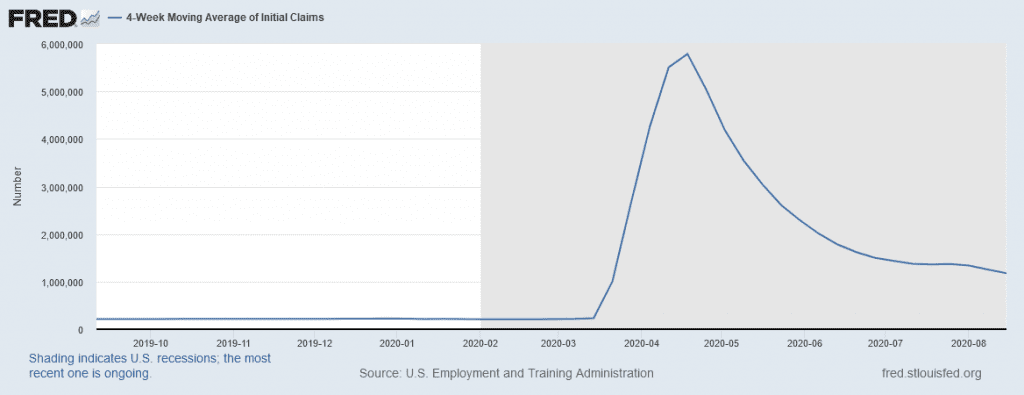
This is a graphic of the four-week moving jobless claims average. That curve is 82% lower than it was at its peak on the 18th of April. There is only one thing that could make that curb decline so sharply, and over such a short period of time, and it is simply because people are back to work, and by the millions. Do you notice the inverted “V”?
Over the last 90 days, according to the labor department we have created 9.33 million payrolls. Clearly, that means more income, and less dependency on government aid. By extension, that implies that consumer confidence is stronger today. What do confident consumers do? They spend money.
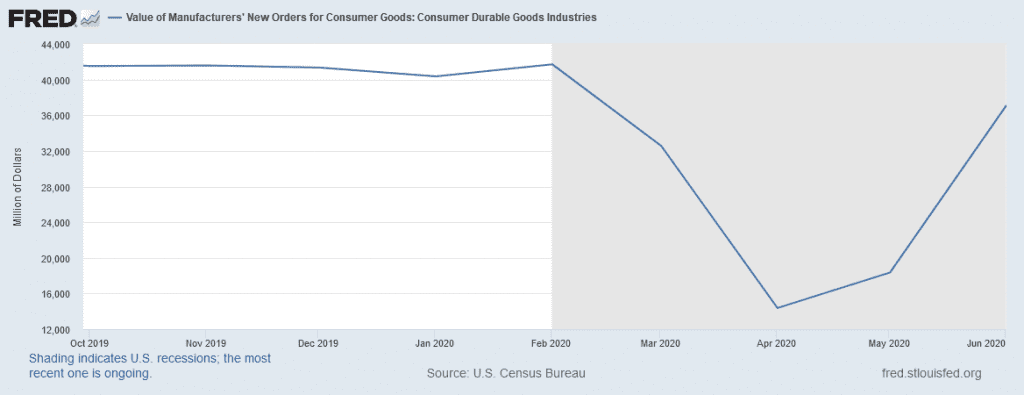
This is a graphic depicting durable goods spending by households. This would include refrigerators, cars, boats, and other long-lasting durable goods items. Do you notice the letter “V”?
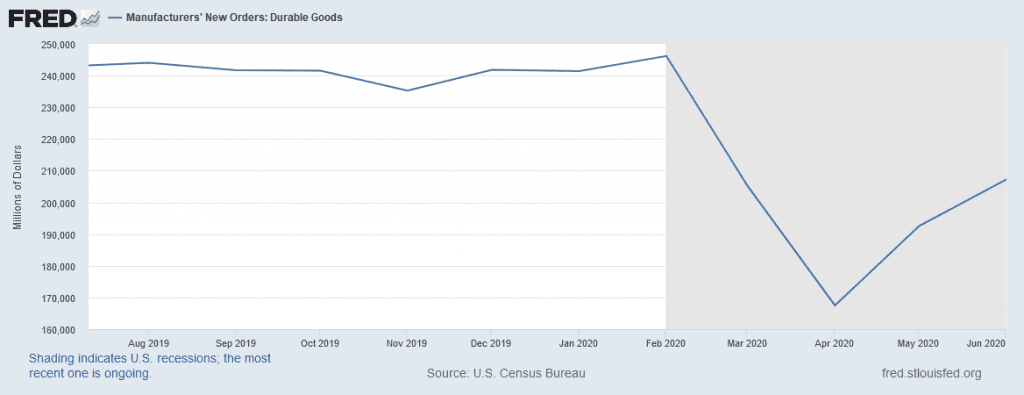
On the corporate spending side, we can also discern a similar “V” shaped pattern when it comes to capital expenditures.
Recently, two of my clients retired, and in the process the sold thier primary residences. Both sold their homes for a greater amount down for which it was listed. They described a “bidding war” among potential purchasers.
This is a graphic depicting the existing home sales for the month of July. Toward the far right of that graphic, can you pick out the very pronounced and capital letter “V”? I’m sorry, but people generally do not get into bidding wars for houses when the economy is going backwards.
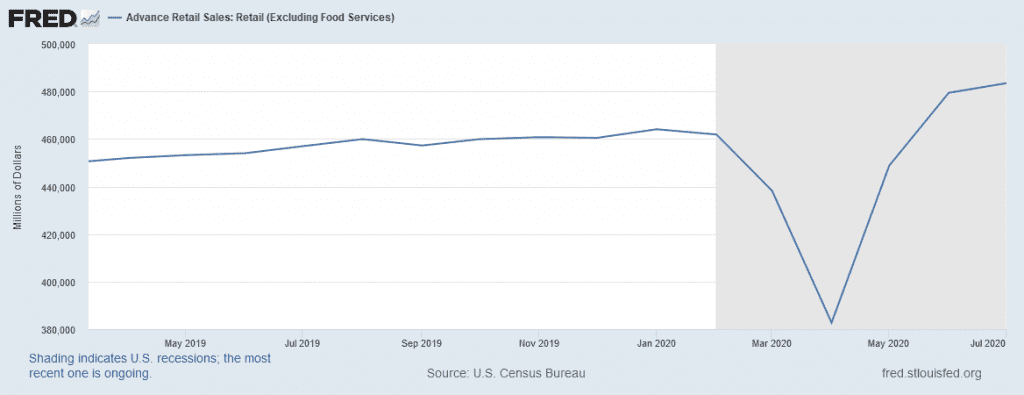
Continuing with consumer sentiment, now I’m showing you a graphic that depicts retail sales. Again, sequestration while flattening the curve did not quell consumerism, but it simply was redirected through other channels. Again, can you discern the letter “V” in this graphic? People who are poor in spirit, and poor and wallet, generally do not establish historical patterns of spending as we observed in May of this year. This graphic is not a characteristic associated with an economy in decline.
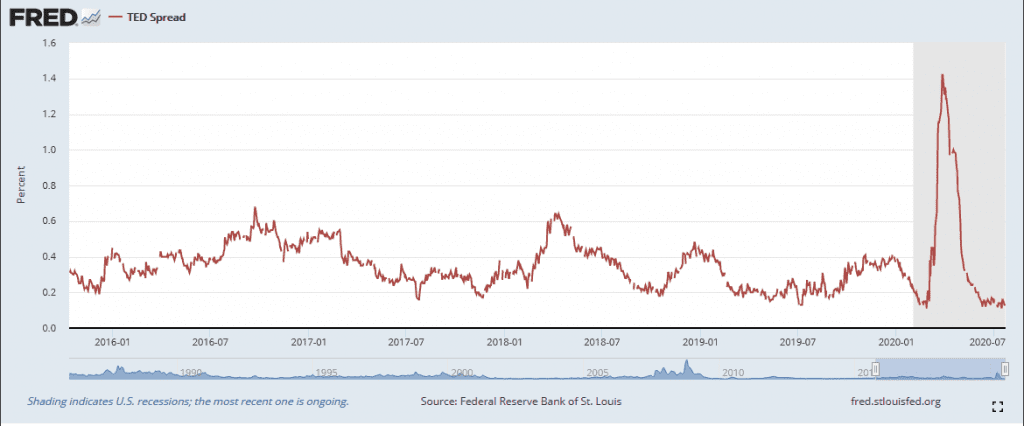
This is a graphic that we have observed within our podcasts of the TED spread. This is viewed as a proxy of sentiment for the bond market. In general, if the perception is for improving economic conditions ahead, then you will have a very tight spread which we observe today at 16 basis points. Can you see the very sharp inverted “V” on this graphic?
The bond market, as evidenced by this graphic, clearly expects the continuation of strengthening economic conditions.
Back to the question of this being smoke and mirrors, we also routinely monitor quantifiable metrics from around the globe.
This is a graphic that depicts the purchasing managers index for nations ranging from China, through the Eurozone, to the United States. Any reading above 50 indicates expansion, while any reading below 50 indicates contraction. This is a quantifiable look into the industrial output of any given nation. You were either making things, or you’re not. Clearly, we have indeed seen a strong resurgence from recent low points to where we are today. By extension, this indicates that people are actually in the factories, making things, for which there is strong demand, and because readings remain above expansion levels, we can assume that no resurgence of COVID-19 has interrupted that progress.
So in conclusion, be very wary about haphazard predictions concerning the letter “V”. Clearly, we could not predict this five months ago, but likewise neither could anyone accurately predict that we would not observe these patterns of economic recovery. The main take away is that you must be mindful of the objective for which you are investing, and the goal that you were pursuing. If your holding period is 10 years or longer, then you had a golden opportunity to invest through this decline and purchase shares of certain things at a low point that could result in the greatest rate of return of any share of anything that you’ve ever purchased.
If you’ve missed this part of the recovery to date, please don’t give up. Economic conditions change by the day. Right now, I’m helping clients discern where the next sets of opportunities may be found in the market as the economy continues to recover. It is at times like these that I must separate myself from the noise and remain focused on what can be quantified. You should do exactly the same thing. I hope this observation of economic facts helps to provide clarity as to the reasons behind the market recovery year to date.


