Is The Economic Cycle Shifting?
I believe that the most pressing concern on the minds of my clients at the present time is inflation, and the evidence that is beginning to suggest a slowing of economic activity. On Wednesday of last week, Brandon and I had the opportunity to meet Brian Wesbury, the chief economist at First Trust, while attending a half-day seminar here in Birmingham. It was reassuring to hear that our views on the economy were largely congruent with those of Brian, and that we found ourselves concerned by similar things.

David, Brandon & Brian Wesbury-
First Trust Event
Seasons Change…
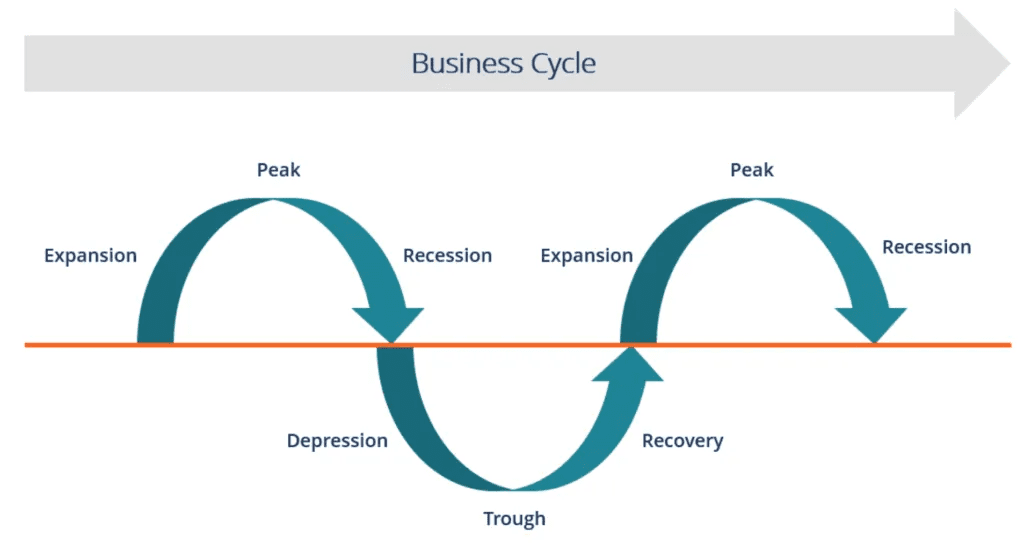
Let me show you a chart that depicts the business cycle. I like this chart because it is a simple graphical depiction of an otherwise complex cycle that impacts our decisions regarding sector exposure, and the investment advisory services that we render to our clients. I have encouraged my clients to think of this chart in terms of seasons. Think about how your behavior is incentivized by what you feel. When it is cold, you are likely incentivized to wear jackets and jeans in response. During the heat of the summer months, you are likely incentivized to wear shorts and spend time in your swimming pool.

New Economic Patterns
About eight months ago, I believe that we were squarely in the expansion, to peak phase of the economic cycle. Typically, this part of the cycle is characterized by rising wages, low inflation, lower taxes, higher velocity of money, and greater consumption activity that is focused in discretionary areas. Therefore, at a high level, long-term investors would benefit from having greater weightings in areas such as consumer discretionary spending, technology, industrials, and transportation stocks during this phase of the economic cycle.
Today, I am monitoring the patterns of several dozen economic indicators, and these patterns are suggesting that conditions are changing. These patterns are suggesting that what you are feeling today is changing. My question therefore is to what degree might we expect consumers to begin wearing long sleeves instead of short sleeves?
Granted, we have only six months-worth of data to evaluate, but the patterns are familiar. Today, it would appear that wages are stagnating, inflation is clearly rising, we are already beginning to see evidence of a declining velocity of money, and deference is being given to the consumption of staples items over the consumption of discretionary items. Will this persist? Only time will tell, but for the time being, it appears that we are indeed at the beginning stages of an economic cycle shift.
What are the forces behind this shift? There are too many to discuss within the confines of this article, but let me cite one particular economic input that impacts us all. We all consume gasoline.

Commodities That Impact Us All
Regardless of wealth or economic status, we all are impacted by gasoline. Everything that we consume involved fuel to some extent. Clearly, you must travel to work, travel to the grocery store, and to take children to school. It is an economically inelastic commodity. That means that you will largely consume the same quantity of the commodity in any given month regardless of its price.
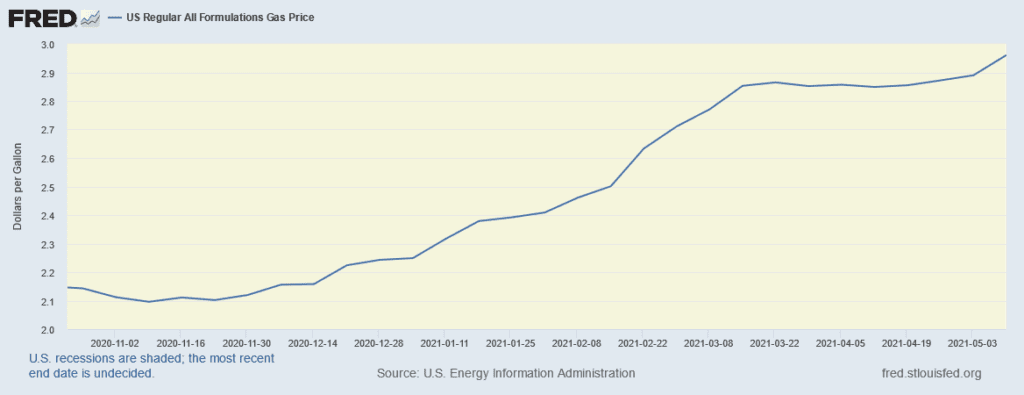
As late as November of last year, the national average for a gallon of gasoline was about $2.10. Today, it is $2.97. Clearly, the recent disruption of supply related to Colonial Pipeline has impacted the equilibrium price of gasoline. Lately, many economists are suggesting that higher than average inflation, and particularly as it relates to gasoline, may be more transient than systemic. Frankly, I believe it is the other way around. I believe it is more systemic than transient. If you’ll recall your high school physics, remember that for every action, there is an equal and opposite reaction. Regardless of whether the upward pressure is systemic or transient, it nonetheless results in a reaction. The stimulus of rising prices, precipitates a reaction of changes in consumer behavior, as you remain with fewer dollars with which to consume other goods and services.
Seventy percent of gross domestic product comes from personal consumption. Let’s say for example that you have $10 to spend per month. Last month, you spent one dollar for gasoline. This month, you are spending nearly 2 dollars per month for gasoline. Regardless of the transient or systemic cause behind the rise in price, you are nonetheless left with fewer dollars this month to consume other things than you had the month before. We now have six months-worth of data that is beginning to show a developing pattern of consumption attitudes shifting away from discretionary items to staples items. Said another way, if these trends persist, it is my belief that you will become increasingly less likely to consume greater amounts of that seven-dollar cup of designer coffee. You will however continue to consume consistent amounts of staples such as toothpaste, toilet paper, bars of soap, and pharmaceuticals for example.
Inflation
According to the most recent data, inflation is significantly higher today than it was just one year ago. If you annualize the last six months-worth of data, inflation at the producer level is tracking at a 12% rate. On the consumer level, the level where you feel warmth or coolness, it is tracking at a 9.6% annualized rate. I doubt that we will actually see inflation rates to this degree, because to a large extent we are seeing a recovery from the deflationary impact of a COVID related economic shutdown.
Nonetheless, last week we learned that over the previous 12 months inflation at the producer level was 6.2% higher. The cost of input for the manufacturing of the products that you consume, and the services that you consume, increased by 6.2% from April of last year through April of this year. Those higher costs of input rarely stay at the producer level. They generally translate to the consumer, where you feel the impact.
Over the same period of time, we learned that the consumer price index increased by 4.2% from April of last year through April of this year. This is alarming, because according to the Bureau of Labor Statistics, this is the highest rate of inflation over a one-year period of time that we have observed since the Jimmy Carter administration. Over the last 20 years, inflation has averaged 2.6% per year. Inflation over the previous 12 months was nearly twice the average rate that we had seen over the previous 20 years. Clearly this is going to have an impact on consumer spending. Historically, this incentivizes individuals to increase rates of personal saving, and to focus spending on critical areas such as staples items rather than on discretionary items. Whether this is merely a bump in the road, or the beginning of a new downward trend in the business cycle remains to be confirmed by time. Having said that, we do have six months of softening data, and over the 30 years of my career I can say that I have seen this pattern develop many times before.
So, What’s the Plan?
So, how can you make this information work to your benefit? The answer to that question will be as individualized as your thumbprint. At a very high level however we are recommending to our clients that they overweight areas that could potentially thrive under changing economic conditions. There is no one-size-fits-all answer to that question, and it is entirely a function of individualized financial planning, and resulting investment strategies for the achievement of individual goals. I would strongly suggest that this is not the time for an autopilot approach to investment management. Be aware of changing economic conditions, as they are already showing patterns of evolution, and remember that we haven’t yet received the formal proposal for potential changes to the tax code for next year.


