
Within previous articles, I’ve written about these three subjects in depth, and offered my thoughts on how these and other factors were contributing to market volatility. Given the historic drawdown we experienced at the beginning of the year, many people are asking if these forces have abated, or worsened, and how might these factor into the remainder of the year?
These are great questions, and yes, I have some updated thoughts on each of these matters that I can share with our readers. So, let’s take these one at a time, and let’s begin with the Federal Reserve. Personally, I do wish that President Trump would cease in his public efforts to call for the resignation of Jerome Powell. If there are conflicts between the Executive Branch of our government and the leadership of the Federal Reserve, personally I think those would be best addressed behind closed doors, and not on Truth Social.
This may be an unpopular opinion, but its mine, and I’m comfortable in my basis behind the opinion. If I Chairman Powell, I wouldn’t be advocating for a cut to the discount rate at this time either. I think the Federal Reserve is doing exactly what it should do at the present time, with the data that is on the table.
Then again, I can make a case that both Chairman Powell and President Trump are correct in their opinions regarding inflation, and the posture of the Federal Reserve as it pertains to monetary policy.
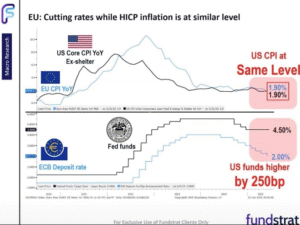 The Fed’s favorite measure of inflation is the personal consumption expenditures deflator, or PCE deflator. In this graphic, we’re looking at CPI ex shelter. Owner’s equivalent rent is falling, and pretty quickly, and so by this metric, inflation stands at 1.90% and below the Fed’s stated target of 2.0%. The European Central Bank also has a similar metric, that is also at 1.90% today as well.
As you can see, our discount rate remains stubbornly at 4.50% while the discount rate of the ECB is much lower at 2.00%. President Trump is correctly asserting that a metric that is entirely under the control of the Federal Reserve, remains high relative to similar global metrics, and by definition, this creates an economic competitive imbalance. So long as this disparity remains, we are by definition less competitive in the world, and President Trump would like to see our discount rate lowered to levelize the playing field.
Then again, Chairman Powell is pointing to the tariffs that remain on the table. On the first of July, within an interview at a banking forum in Sintra, Portugal, Chairman Powell said that the Federal Reserve would have likely lowered interest rates by now if it weren’t for the President’s changes to tariff policy.
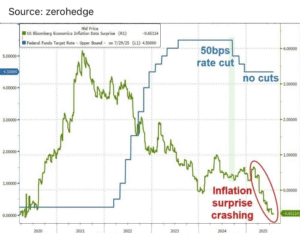 So, this isn’t about current inflation. The rate of inflationary change has reduced significantly over the last five years, and today, according to the favorite measure of the Federal Reserve, it appears to be below their stated target of 2.0%.
Look, the longer tariffs remain on the table, then it becomes increasingly likely that you’ll pay more for this pen. In the opinion of Chairman Powell, the Fed can’t pour economic gasoline on a smoldering ember after having fought the inflation inferno for the last five years. So, I see both points, and they’re both correct.
In my opinion, we are clearly beginning to see the positive effects of “round two” of President Trump’s efforts to leverage tariffs in an effort to achieve economic detonate. I’ll opine on that in more detail shortly. For now, we are beginning to recognize the geoeconomic and geopolitical outcomes for which the president sought. You and I can debate whether these tariffs are chess moves, or permanent sources of perpetual revenue. The Federal Reserve doesn’t have that luxury. They must adjudicate policy moves based on what they can quantify on the table today, and today, there remains too much uncertainty over the future state of the economy as a function of tariffs.
At the same time, we must all remember that the Federal Reserve is an autonomous agency, and not an extension of the Executive Branch, and nor do you want it to be. Otherwise, we lose faith in our banking and reserve system, and I think Chairman Powell is doing what he should do at the present time.
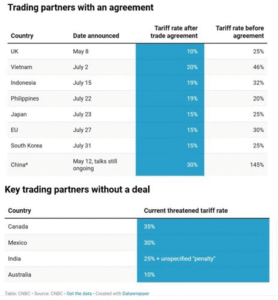 Every day, we get another list of countries with which we’ve codified new trading agreements. I have no idea where Myanmar is, but I can tell you that we have a trading agreement with them. From time to time, we see a big one, like the UK, Japan, and China. The more clarity we have, then the more latitude the Fed may find in being more accommodative throughout the year. Should that happen, then I think this could be a significantly positive catalyst for markets over the remainder of the year.
So, when it comes to economic observations, about the economy, the Federal Reserve must be front and center in that conversation, and hence why I’m often asked for my thoughts on the health of the economy right now, and my outlook for the future.
Honestly, I think the economy is in pretty good shape. When you consider such metrics as the ISM manufacturing and services index, durable goods orders, new orders, factory orders, capacity utilization, personal consumption, and the velocity of money, none of these metrics in my opinion, are characteristic of an economy in decline.
Then again, we had a much weaker than expected employment report just last month, and revisions to previous months were also lower. To me, this speaks to the adverse consequences of a significant shift in tariff policy. If I make widgets, and many of the components that go into the manufacturing of that widget come from overseas markets, and if those input costs are rising as a result of the tariffs, then it stands to reason that I might put plans for expansion on hold until I have greater clarity regarding costs of manufacturing.
Then again, as we get greater clarity regarding tariff policy, and if that translates into greater latitude for the Federal Reserve to be increasingly accommodative, then I would likewise anticipate a significant snap back, or improvement in such employment metrics as a result. I can make a case supporting an economic surge in the second half of the year should we continue along this path. Then again, if tariffs linger for longer, and uncertainty continues to be problematic, then I can make a case for such being a catalyst for economic stagnation.
 I think we have a unique opportunity to look back at Trump 1.0 and remember what happened the last time. Remember NAFTA? The North American Free Trade Agreement? Well, we didn’t achieve that without much saber rattling and bluster over tariffs then either. Now we’re trying to negotiate NAFTA 2.0. Did it work the last time? Indeed. Several economic metrics hit all-time record highs between 2018 into 2019. Can you say that those records were 100% the result of NAFTA? Maybe not, but then again, we didn’t have those highs until we had NAFTA, and we didn’t have NAFTA until we had the saber rattling and bluster.
So my advice is let’s all be patient and see if we get a similar result this time.
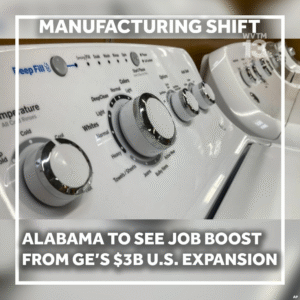
 Every day, it seems that we’re hearing from more and more companies that are repatriating manufacturing activity back to the United States. We heard the same thing in 2017 too. Over the ensuing 12 to 18 months, we saw several manufacturing, industrial, and economic metrics hitting all time record highs, or near term highs, and clearly all of that activity was positively correlated. I can cross check this with another metric that is publicly available from the Atlanta Federal Reserve Bank. Wages.
We’ve heard a lot about how the economic policies of this president are geared toward the ultra-wealthy and the billionaires. Well, by the numbers, that didn’t seem to be the case over the first three non-Covid years of Trump 1.0 as evidenced by this metric from the Atlanta Fed.
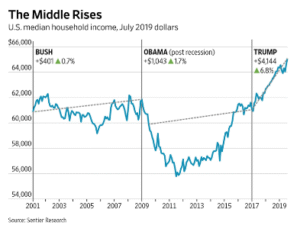
I had to blow the dust off this graphic from several years ago. The Atlanta Fed tracks employment data across many genres of employment. Over the first three years of the first Trump presidency, the employment group that saw the greatest average annual income increase were those in construction and mining. You may have a few billionaires in that genre, but you also have all of the trade unions. This is where you’ll find the blue collar, industrial workers who are the salt of middle America.
From 2017 through 2019, their wages grew by an average of 6.8% per year for three years. That same employment group saw their wages grow by 1.7% per year under the eight years of President Obama, and by only 0.7% per year under the eight years of President Bush. By this metric, I think you can clearly say that indeed, the economic policies of Trump 1.0 worked the last time, and I think it’s reasonable to anticipate a repeat under Trump 2.0.
It’s all interwoven and nothing exists in a vacuum. One domino will impact another if set into motion, and right now, I see an economy that is in pretty good shape all things considered. The question is more about what happens next. A booming economy or a stagnant economy remains in the balance.
The third topic that has seemingly dominated client conversations of late, and frankly for well over a year, remains the impact of the “Magnificent Ten” on market metrics. Honestly, we could devote an entire article to just this one topic. Speaking only for me, he who forgets history might well repeat it. We’ve seen an event driven, rapid adoption of technology before. Remember Y2K? And before anyone says, its different this time, think again. It’s never different, but that’s what we tell ourselves for comfort.
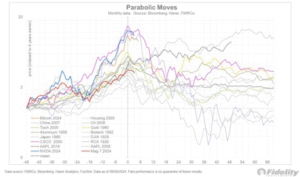 That’s what they said about RCA in 1929, and about housing in 2008, and about technology in 2000, and aluminum in 1958. It’s different this time. Or, is it? How many parabolic moves do we need to see build, and burst, to understand the forces that build bubbles may be different, but the outcome rarely is. So, let me ask – which was the last parabolic move that never burst?
At the beginning of the year, we observed that 40% of the S&P 500 Index was represented by 10 stocks.
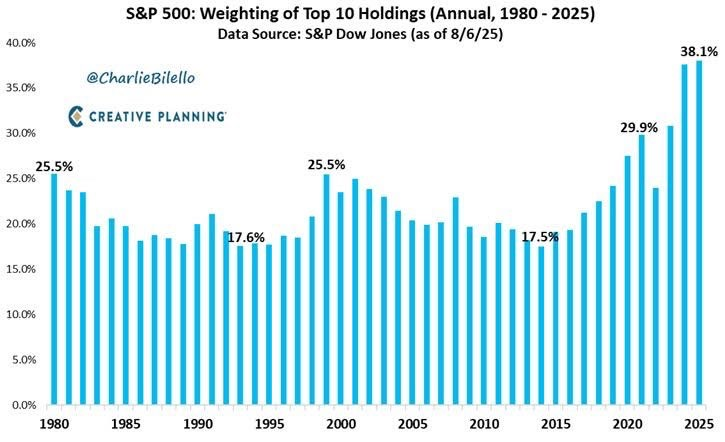 In my opinion, the Y2K concentration from 2000 pales in comparison with the imbalance that we have today. There are 503 stocks in the S&P 500 index, and as of the 6th of August, these ten stocks still control over 38% of the weight of the index. In my opinion, this has been driven by an inflation crisis that seems to have come to an end, and it’s also been driven by the anticipation of how such technology might be a driver behind future earnings and revenue. While that may remain in our future, we have yet to really appreciate this result, and we have an historic market imbalance as a result. Just when you think these metrics can’t get worse, it does.
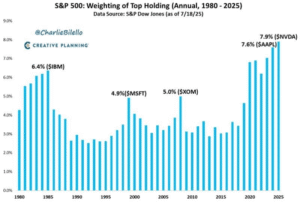 Fifteen and one half percent of the S&P 503 index is represented by only TWO stocks. In the nearly 34 years of my career, I have never seen anything close to the market imbalance that we have today. This is translating into the stock weightings of index funds, and growth mutual funds. They’re doing what they were designed to do, but with this historic skew in the favor of a handful of stocks, investors may not realize the skew in their own portfolios.
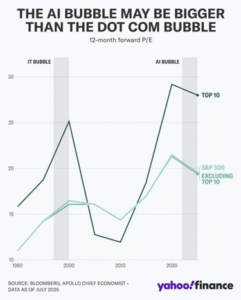
 So, when you read bombastic headlines like this, please take it with a grain of salt. This might otherwise get my attention if the S&P 503 wasn’t 38.1% skewed to only ten stocks. Take those ten stocks out and you get a MUCH different picture in terms of valuation.
In my opinion, no, the remaining non magnificent ten side of the market is not overly valued. It is especially critical at the present time to not be satisfied with superficial observations. You MUST look more deeply than the surface to truly appreciate what’s happening.
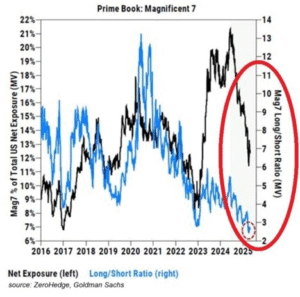
By the way, the warning signs are evident and publicly available, and have been for a while.
Using hedge funds as a reference, the level of bearishness among these AI thematic stocks has never been lower.
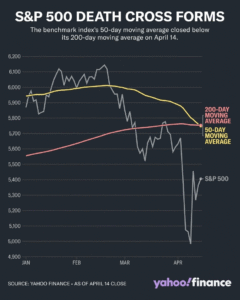
 Again, we’ve seen this before. I don’t care what the technology might be. If the anticipation of productivity gains, and efficiency, and cost savings that might result from the technology isn’t supported by earnings and revenue, which it doesn’t appear to be at the present time, then at some point, it’s reasonable to expect a correction. In my opinion, we saw this earlier this year, on Monday, the 27th of January, when NVDIA set the record for the largest loss ever recorded by one company, in any single day, in the history of the stock market. Tesla and Apple were also significantly caught by that wave of selling as well.
 Over the 34 years of my career, I’ve come to appreciate that when you see articles such as these with frequency in the publicly available, free information space like the Financial Times, or Yahoo Finance, it’s a good indicator that the trend at hand may be aging quickly.
As I mentioned earlier, all it took was a rumor from China regarding a new technology called Deep Seek to send the technology market and these AI behemoths reeling on Monday the 27th of January.
I don’t know what might be the next catalyst to cause the market to capitulate, but we’ve already seen one this year, and in my opinion, warning signs are everywhere, and evident. And, at a time when in my opinion, there is discernible value to be found in the other ten sectors of the economy.
So, I can’t give investment advice to the general public in a medium like this, but if you’re wondering about my personal view on this magnificent ten, AI thematic part of the market, it would simply be to evaluate the risk of this, or of any investment, against your tolerance for taking risk, and as a function of the goals you’re trying to achieve, and in the process, evaluate whether or not there may be better potential for growth, from within sectors that may not be overly valued, and make that personal call for yourselves. It’s when people become complacent that adverse consequences can occur.
In closing, pay much more attention to the goals you’re trying to achieve more so than to the stock pick of the day. Work with a professional who can codify those goals into an actionable, long-term plan, and let that plan drive the allocation of the accounts that you’re leveraging for the achievement of those planning goals. When you have a long term, planning driven perspective, it helps to shift attention away from the minute to minute, and back to the year over year view.
(*) David R. Guttery, RFC, RFS, CAM, is a financial advisor, and has been in practice for 33 years, and is the Chief Executive Officer of Keystone Financial Group in Trussville, Alabama, and inSOURCE Financial Advisors in Lincoln, Nebraska. David offers products and services using the following business names: Keystone Financial Group and inSOURCE Financial Advisors – insurance and financial services | Ameritas Investment Company, LLC (AIC), Member FINRA / SIPC – securities and investments | Ameritas Advisory Services – investment advisory services. AIC and AAS are not affiliated with Keystone Financial Group or inSOURCE Financial Advisors. Information provided is gathered from sources believed to be reliable; however, we cannot guarantee their accuracy. This information should not be interpreted as a recommendation to buy or sell any security. Past performance is not an indicator of future results. Examples are for illustrative purposes only and should not be considered representative of any investment. Investments involve risks, including loss of principal.

